
| Home | Sources Directory | News Releases | Calendar | Articles | | Contact | |
Body mass index

Based on World Health Organization data here.
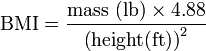
The body mass index (BMI), or Quetelet index, is a heuristic measure of body weight based on a person's weight and height. Though it does not actually measure the percentage of body fat, it is used to estimate a healthy body weight based on a person's height. Due to its ease of measurement and calculation, it is the most widely used diagnostic tool to identify weight problems within a population, usually whether individuals are underweight, overweight or obese. It was invented between 1830 and 1850 by the Belgian polymath Adolphe Quetelet during the course of developing "social physics".[1] Body mass index is defined as the individual's body weight divided by the square of his or her height. The formulae universally used in medicine produce a unit of measure of kg/m2. BMI can also be determined using a BMI chart,[2] which displays BMI as a function of weight (horizontal axis) and height (vertical axis) using contour lines for different values of BMI or colors for different BMI categories.
| SI units |  |
|---|---|
| Imperial units |  |
 |
Contents |
[edit] Usage
While the formula previously called the Quetelet Index for BMI dates to the 19th century, the new term "body mass index" for the ratio and its popularity date to a paper published in the July edition of 1972 in the Journal of Chronic Diseases by Ancel Keys, which found the BMI to be the best proxy for body fat percentage among ratios of weight and height;[3][4] the interest in measuring body fat being due to obesity becoming a discernible issue in prosperous Western societies. BMI was explicitly cited by Keys as being appropriate for population studies, and inappropriate for individual diagnosis. Nevertheless, due to its simplicity, it came to be widely used for individual diagnosis, despite its inappropriateness.
BMI provided a simple numeric measure of a person's "fatness" or "thinness", allowing health professionals to discuss over- and under-weight problems more objectively with their patients. However, BMI has become controversial because many people, including physicians, have come to rely on its apparent numerical authority for medical diagnosis, but that was never the BMI's purpose; it is meant to be used as a simple means of classifying sedentary (physically inactive) individuals with an average body composition.[5] For these individuals, the current value settings are as follows: a BMI of 18.5 to 25 may indicate optimal weight; a BMI lower than 18.5 suggests the person is underweight while a number above 25 may indicate the person is overweight; a BMI below 17.5 may indicate the person has anorexia nervosa or a related disorder; a number above 30 suggests the person is obese (over 40, morbidly obese).
For a given height, BMI is proportional to weight. However, for a given weight, BMI is inversely proportional to the square of the height. So, if all body dimensions double, and weight scales naturally with the cube of the height, then BMI doubles instead of remaining the same. This results in taller people having a reported BMI that is uncharacteristically high compared to their actual body fat levels. In comparison, the Ponderal index is based on this natural scaling of weight with the third power of the height. However, many taller people are not just "scaled up" short people, but tend to have narrower frames in proportion to their height. It has been suggested that instead of squaring the body height (as the BMI does) or cubing the body height (as the Ponderal index does), it would be more appropriate to use an exponent of between 2.3 and 2.7.[6]
[edit] BMI Prime
BMI Prime, a simple modification of the BMI system, is the ratio of actual BMI to upper limit BMI (currently defined at BMI 25). As defined, BMI Prime is also the ratio of body weight to upper body weight limit, calculated at BMI 25. Since it is the ratio of two separate BMI values, BMI Prime is a dimensionless number, without associated units. Individuals with BMI Prime < 0.74 are underweight; those between 0.74 and 0.99 have optimal weight; and those at 1.00 or greater are overweight. BMI Prime is useful clinically because individuals can tell, at a glance, by what percentage they deviate from their upper weight limits. For instance, a person with BMI 34 has a BMI Prime of 34/25 = 1.36, and is 36% over his or her upper mass limit. In Asian populations (see International Variation section below) BMI Prime should be calculated using an upper limit BMI of 23 in the denominator instead of 25. Nonetheless, BMI Prime allows easy comparison between populations whose upper limit BMI values differ.[7]
[edit] Categories
A frequent use of the BMI is to assess how much an individual's body weight departs from what is normal or desirable for a person of his or her height. The weight excess or deficiency may, in part, be accounted for by body fat (adipose tissue) although other factors such as muscularity also affect BMI significantly (see discussion below and overweight). The WHO[8] regard a BMI of less than 18.5 as underweight and may indicate malnutrition, an eating disorder, or other health problems, while a BMI greater than 25 is considered overweight and above 30 is considered obese. These ranges of BMI values are valid only as statistical categories when applied to adults, and do not predict health.
| Category | BMI range ' kg/m2 | BMI Prime | Mass (weight) of a 1.8 metres (5 ft 11 in) person with this BMI |
|---|---|---|---|
| Severely underweight | less than 16.5 | less than 0.66 | less than 53.5 kilograms (8.42 st; 118 lb) |
| Underweight | from 16.5 to 18.4 | from 0.66 to 0.73 | between 53.5 and 59.9 kilograms (8.42 and 9.43 st; 118 and 132 lb) |
| Normal | from 18.5 to 24.9 | from 0.74 to 0.99 | between 60 and 80.9 kilograms (9.4 and 12.74 st; 130 and 178 lb) |
| Overweight | from 25 to 29.9 | from 1.0 to 1.19 | between 81 and 96.9 kilograms (12.8 and 15.26 st; 180 and 214 lb) |
| Obese Class I | from 30 to 34.9 | from 1.2 to 1.39 | between 97 and 112.9 kilograms (15.3 and 17.78 st; 210 and 249 lb) |
| Obese Class II | from 35 to 39.9 | from 1.4 to 1.59 | between 113 and 129.9 kilograms (17.8 and 20.46 st; 250 and 286 lb) |
| Obese Class III | over 40 | over 1.6 | from 130 kilograms (20 st; 290 lb) |
The U.S. National Health and Nutrition Examination Survey of 1994 indicates that 59% of American men and 49% of women have BMIs over 25. Morbid obesity'a BMI of 40 or more'was found in 2% of the men and 4% of the women. The newest survey in 2007 indicates a continuation of the increase in BMI: 63% of Americans are overweight, with 26% now in the obese category (a BMI of 30 or more). There are differing opinions on the threshold for being underweight in females; doctors quote anything from 18.5 to 20 as being the lowest weight, the most frequently stated being 19. A BMI nearing 15 is usually used as an indicator for starvation and the health risks involved, with a BMI <17.5 being an informal criterion for the diagnosis of anorexia nervosa.
[edit] BMI-for-age

|

|
BMI is used differently for children. It is calculated the same way as for adults, but then compared to typical values for other children of the same age. Instead of set thresholds for underweight and overweight, then, the BMI percentile allows comparison with children of the same sex and age.[9] A BMI that is less than the 5th percentile is considered underweight and above the 95th percentile is considered obese for people 20 and older. People under 20 with a BMI between the 85th and 95th percentile are considered to be overweight.
Recent studies in Britain have indicated that females between the ages 12 and 16 have a higher BMI than males of the same age by 1.0 kg/m2 on average.[10]
[edit] International variations
These recommended distinctions along the linear scale may vary from time to time and country to country, making global, longitudinal surveys problematic. In 1998, the U.S. National Institutes of Health brought U.S. definitions into line with World Health Organization guidelines, lowering the normal/overweight cut-off from BMI 27.8 to BMI 25. This had the effect of redefining approximately 25 million Americans, previously "healthy" to "overweight".[11] It also recommends lowering the normal/overweight threshold for South East Asian body types to around BMI 23, and expects further revisions to emerge from clinical studies of different body types.
[edit] Japanese definition
| Category | BMI range ' kg/m2 |
|---|---|
| Normal | from 18.5 to 22.9 |
| Overweight | from 23.0 to 24.9 |
| Obese | 25.0 and above |
[edit] Singapore
In Singapore, the BMI cut-off figures were revised in 2005 with an emphasis on health risks instead of weight. Adults whose BMI is between 18.5 and 22.9 have a low risk of developing heart disease and other health problems such as diabetes. Those with a BMI between 23 and 27.4 are at moderate risk while those with a BMI of 27.5 and above are at high risk of heart disease and other types of health problems.[13]
| Category | BMI range ' kg/m2 |
|---|---|
| Emaciation | less than 14.9 |
| Underweight | from 15 to 18.4 |
| Normal | from 18.5 to 22.9 |
| Overweight | from 23 to 27.5 |
| Obese | from 27.6 to 40 |
| Morbidly Obese | greater than 40 |
[edit] Applications
[edit] Statistical device
The BMI is generally used as a means of correlation between groups related by general mass and can serve as a vague means of estimating adiposity. The duality of the BMI is that, whilst easy-to-use as a general calculation, it is limited in how accurate and pertinent the data obtained from it can be. Generally, the index is suitable for recognizing trends within sedentary or overweight individuals because there is a smaller margin for errors.[14]
This general correlation is particularly useful for consensus data regarding obesity or various other conditions because it can be used to build a semi-accurate representation from which a solution can be stipulated, or the RDA for a group can be calculated. Similarly, this is becoming more and more pertinent to the growth of children, due to the majority of their exercise habits.[15]
The growth of children is usually documented against a BMI-measured growth chart. Obesity trends can be calculated from the difference between the child's BMI and the BMI on the chart.
[edit] Clinical practice
BMI has been used by the WHO as the standard for recording obesity statistics since the early 1980s. In the United States, BMI is also used as a measure of underweight, owing to advocacy on behalf of those suffering with eating disorders, such as anorexia nervosa and bulimia nervosa.[citation needed]
BMI can be calculated quickly and without expensive equipment. However, BMI categories do not take into account many factors such as frame size and muscularity.[14] The categories also fail to account for varying proportions of fat, bone, cartilage, water weight, and more.
Despite this, BMI categories are regularly regarded as a satisfactory tool for measuring whether sedentary individuals are "underweight", "overweight" or "obese" with various exemptions, such as: athletes, children, the elderly, and the infirm.
One basic problem, especially in athletes, is that muscle weight contributes to BMI. Some professional athletes would be "overweight" or "obese" according to their BMI, despite them carrying little fat, unless the number at which they are considered "overweight" or "obese" is adjusted upward in some modified version of the calculation. In children and the elderly, differences in bone density and, thus, in the proportion of bone to total weight can mean the number at which these people are considered underweight should be adjusted downward.
[edit] Medical underwriting
In the United States, where medical underwriting of private health insurance plans is widespread, most private health insurance providers will use a particular high BMI as a cut-off point in order to raise insurance rates for or deny insurance to higher-risk patients, thereby ostensibly reducing the cost of insurance coverage to all other subscribers in a 'normal' BMI range. The cutoff point is determined differently for every health insurance provider and different providers will have vastly different ranges of acceptability. Many will implement phased surcharges, in which the subscriber will pay an additional penalty, usually as a percentage of the monthly premium, for each arbitrary range of BMI points above a certain acceptable limit, up to a maximum BMI past which the individual will simply be denied admissibility regardless of price. This can be contrasted with group insurance policies which do not require medical underwriting and where insurance admissibility is guaranteed by virtue of being a member of the insured group, regardless of BMI or other risk factors that would likely render the individual inadmissible to an individual health plan[citation needed].
[edit] Limitations and shortcomings
Some argue that the error in the BMI[16] is significant and so pervasive that it is not generally useful in evaluation of health.[17][18] University of Chicago political science professor Eric Oliver says BMI is a convenient but inaccurate measure of weight, forced onto the populace, and should be revised.[19]
The medical establishment has generally acknowledged some shortcomings of BMI.[20] Because the BMI is dependent only upon weight and height, it makes simplistic assumptions about distribution of muscle and bone mass, and thus may overestimate adiposity on those with more lean body mass (e.g. athletes) while underestimating adiposity on those with less lean body mass (e.g. the elderly).
A 2005 study in America showed that overweight people had a similar relative risk of mortality to normal weight people as defined by BMI, while obese people had a higher death rate.[21]
In an analysis of 40 studies involving 250,000 people, patients with coronary artery disease with normal BMIs were at higher risk of death from cardiovascular disease than people whose BMIs put them in the "overweight" range (BMI 25'29.9).[22] In the intermediate range of BMI (25'29.9), BMI failed to discriminate between bodyfat percentage and lean mass. The study concluded that "the accuracy of BMI in diagnosing obesity is limited, particularly for individuals in the intermediate BMI ranges, in men and in the elderly... These results may help to explain the unexpected better survival in overweight/mild obese patients."[23]
Body composition for athletes is often better calculated using measures of body fat, as determined by such techniques as skinfold measurements or underwater weighing and the limitations of manual measurement have also led to new, alternative methods to measure obesity, such as the body volume index. However, recent studies of American football linemen who undergo intensive weight training to increase their muscle mass show that they frequently suffer many of the same problems as people ordinarily considered obese, notably sleep apnea. This is probably because linemen in general, particularly offensive linemen, have both a high muscle weight and a high fat weigt [24][25]
A further limitation relates to loss of height through aging. In this situation, BMI will increase without any corresponding increase in weight.
A study by Romero-Corral et al., using data representing noninstitutionalized civilians in the United States, found that BMI-defined obesity was present in 19.1% of men and 24.7% of women, but that obesity as measured by bodyfat percentage was present in 43.9% of men and 52.3% of women.[23]
The exponent of 2 in the denominator of the formula for BMI is arbitrary. It is meant to reduce variability in the BMI associated only with a difference in size, rather than with differences in weight relative to one's ideal weight. If taller people were simply scaled-up versions of shorter people, the appropriate exponent would be 3, as weight would increase with the cube of height. However, on average, taller people have a slimmer build relative to their height than do shorter people, and the exponent which matches the variation best is between 2 and 3. An analysis based on data gathered in the USA suggested an exponent of 2.6 would yield the best fit for children aged 2 to 19 years old.[26] The exponent 2 is used instead by convention and for simplicity.
As a possible alternative to BMI, the concepts fat-free mass index (FFMI) and fat mass index (FMI) were introduced in the early 1990s.[27]
[edit] Varying standards
|
|
This section does not cite any references or sources. Please help improve this article by adding citations to reliable sources. Unsourced material may be challenged and removed. (April 2010) |
It is not clear where on the BMI scale the threshold for 'overweight' and 'obese' should be set. Because of this the standards have varied over the past few decades. Between 1980 and 2000 the U.S. Dietary Guidelines have defined overweight at a variety of levels ranging from a BMI of 24.9 to 27.1. In 1985 the National Institutes of Health (NIH) consensus conference recommended that overweight BMI be set at a BMI of 27.8 for men and 27.3 for women. In the 1990s the World Health Organization (WHO) decided that a BMI of 25 to 29 should be considered overweight and a BMI over 30 is obese. In 1988 a NIH report concluded that a BMI over 25 is overweight and a BMI over 30 is obese, the same standards WHO established. This became the definitive guide for determining if someone is overweight.
[edit] See also
- Body volume index
- Waist-hip ratio
- Sagittal Abdominal Diameter (SAD)
- Body fat percentage
- Body water
- Allometric law
- Ponderal index
- Rohrer's index
[edit] Further reading
- Focus on Body Mass Index and Health Research at Google Books
- Human body size and the laws of scaling: physiological, performance, growth, longevity and ecological ramifications at Google Books
- Constantin V. Uglea (June 1996). Handbook of Pediatric Obesity: Clinical Management. [CRC Press]. ISBN 978-0-8247-9720-1.
[edit] References
- ^ Eknoyan, Garabed (January 2008). "Adolphe Quetelet (1796-1874)'the average man and indices of obesity". Nephrol. Dial. Transplant. 23 (1): 47'51. doi:10.1093/ndt/gfm517. PMID 17890752.
- ^ E.g., the Body Mass Index Table from the NIH's NHLBI.
- ^ Beyond BMI: Why doctors won't stop using an outdated measure for obesity., by Jeremy Singer-Vine, Slate.com, July 20, 2009
- ^ Keys, Ancel; Fidanza, F; Karvonen, MJ; Kimura, N; Taylor, HL (July 1972). "Indices of relative weight and obesity.". J Chronic Dis.. 1 25 (6): 329'43. doi:10.1016/0021-9681(72)90027-6. PMID 4650929
- ^ "Physical Status: The Use and Interpretation of Anthropometry". WHO Technical Report Series 854: 9. http://whqlibdoc.who.int/trs/WHO_TRS_854.pdf.
- ^ "Calculation of power law relationship between weight and height". http://www.math.utah.edu/~korevaar/ACCESS2003/bmi.pdf.
- ^ Gadzik, J (February 2006). "'How Much Should I Weigh?' - Quetelet's Equation, Upper Weight Limits and BMI Prime". Connecticut Medicine 70 (2): 81'88. PMID 16768059.
- ^ "BMI Classification". World Health Organization. http://www.who.int/bmi/index.jsp?introPage=intro_3.html.
- ^ "Body Mass Index: BMI for Children and Teens". Center for Disease Control. http://www.cdc.gov/nccdphp/dnpa/healthyweight/assessing/bmi/childrens_BMI/about_childrens_BMI.htm.
- ^ "Health Survey for England: The Health of Children and Young People". http://www.archive2.official-documents.co.uk/document/deps/doh/survey02/summ03.htm.
- ^ "Who's fat? New definition adopted". CNN. http://www.cnn.com/HEALTH/9806/17/weight.guidelines/. Retrieved 2010-04-26.
- ^ http://cat.inist.fr/?aModele=afficheN&cpsidt=15705967 Overweight Japanese with body mass indexes of 23.0-24.9 have higher risks for obesity-associated disorders: A comparison of Japanese and Mongolians
- ^ "Revision of Body Mass Index (BMI) Cut-Offs In Singapore". http://www.hpb.gov.sg/hpb/default.asp?TEMPORARY_DOCUMENT=1769&TEMPORARY_TEMPLATE=2.
- ^ a b Jeukendrup, A.; Gleeson, M. (2005). Sports Nutrition. Human Kinetics: An Introduction to Energy Production and Performance. ISBN 9780736034043.
- ^ Barasi, M. E. (2004). Human Nutrition - a health perspective. ISBN 0340810254.
- ^ "BMI calculator from NHS". NHS Choices. 2010-03-22. http://www.nhs.uk/Tools/Pages/Healthyweightcalculator.aspx. Retrieved 2010-03-22.
- ^ "Do You Believe in Fairies, Unicorns, or the BMI?". Mathematical Association of America. 2009-05-01. http://www.maa.org/devlin/devlin_05_09.html. Retrieved 2009-05-22.
- ^ "Is obesity such a big, fat threat?". Cox News Service. 2004-08-30. http://www.rockymounttelegram.com/featr/content/shared/health/stories/BMI_INDEX_0830_COX.html. Retrieved 2007-07-08.
- ^ Sheldon, Linzi (April 26, 2005). "Oliver blames 'obesity mafia' for American weight scare". The Dartmouth. http://thedartmouth.com/2005/04/26/news/oliver/.
- ^ "Aim for a Healthy Weight: Assess your Risk". National Institutes of Health. 2007-07-08. http://www.nhlbi.nih.gov/health/public/heart/obesity/lose_wt/risk.htm#limitations.
- ^ Flegal, K. M.; Graubard, B.I.; Williamson, D. F.; Gail, M. H. (April 2005). "Excess Deaths Associated With Underweight, Overweight, and Obesity". JAMA 293 (15): 1861'1867. doi:10.1001/jama.293.15.1861. PMID 15840860.
- ^ "Association of bodyweight with total mortality and with cardiovascular events in coronary artery disease: a systematic review of cohort studies.". 368. Lancet. 2006-08-19. pp. 666'678. http://www.ncbi.nlm.nih.gov/entrez/query.fcgi?db=pubmed&cmd=Retrieve&dopt=AbstractPlus&list_uids=16920472&query_hl=1&itool=pubmed_DocSum. Retrieved 2007-07-08.
- ^ a b Romero-Corral, A.; Somers, V. K.; Sierra-Johnson, J.; Thomas, R. J.; Collazo-Clavell, M. L.; Korinek, J.; Allison, T. G.; Batsis, J. A. et al. (June 2008). "Accuracy of body mass index in diagnosing obesity in the adult general population". International Journal of Obesity 32 (6): 959'956. doi:10.1038/ijo.2008.11. PMID 18283284.
- ^ Brown, David (January 23, 2003). "Linemen More Likely To Have Sleep Condition". The Washington Post.
- ^ Reinberg, Steven (January 29, 2007). "Ex-NFL Linemen prone to Heart Disease". The Washington Post. http://www.washingtonpost.com/wp-dyn/content/article/2007/01/29/AR2007012900606.html. Retrieved 2010-04-26.
- ^ "Power law fit to USA weight and height data". http://www.math.utah.edu/~korevaar/ACCESS2003/bmi.pdf.
- ^ VanItallie, T.B.; Yang, M.U.; Heymsfield, S.B.; Funk, R.C.; Boileau, R.A. (December 1990). "Height-normalized indices of the body's fat-free mass and fat mass: potentially useful indicators of nutritional status". Am. J. Clin. Nutr. 52 (6): 953'959. PMID 2239792.
[edit] External links
- U.S. National Center for Health Statistics:
| Look up body mass index in Wiktionary, the free dictionary. |
|
SOURCES.COM is an online portal and directory for journalists, news media, researchers and anyone seeking experts, spokespersons, and reliable information resources. Use SOURCES.COM to find experts, media contacts, news releases, background information, scientists, officials, speakers, newsmakers, spokespeople, talk show guests, story ideas, research studies, databases, universities, associations and NGOs, businesses, government spokespeople. Indexing and search applications by Ulli Diemer and Chris DeFreitas.
For information about being included in SOURCES as a expert or spokesperson see the FAQ . For partnerships, content and applications, and domain name opportunities contact us.