
| Home | Sources Directory | News Releases | Calendar | Articles | | Contact | |
Infrared spectroscopy
Infrared spectroscopy (IR spectroscopy) is the subset of spectroscopy that deals with the infrared region of the electromagnetic spectrum. It covers a range of techniques, the most common being a form of absorption spectroscopy. As with all spectroscopic techniques, it can be used to identify compounds and investigate sample composition. A common laboratory instrument that uses this technique is an infrared spectrophotometer.
The infrared portion of the electromagnetic spectrum is usually divided into three regions; the near-, mid- and far- infrared, named for their relation to the visible spectrum. The far-infrared, approximately 400'10 cm'1 (1000'30 î�m), lying adjacent to the microwave region, has low energy and may be used for rotational spectroscopy. The mid-infrared, approximately 4000'400 cm'1 (30'2.5 î�m) may be used to study the fundamental vibrations and associated rotational-vibrational structure. The higher energy near-IR, approximately 14000'4000 cm'1 (2.5'0.8 î�m) can excite overtone or harmonic vibrations. The names and classifications of these subregions are merely conventions. They are neither strict divisions nor based on exact molecular or electromagnetic properties.
Contents |
[edit] Theory
Infrared spectroscopy exploits the fact that molecules absorb specific frequencies that are characteristic of their structure. These absorptions are resonant frequencies, i.e. the frequency of the absorbed radiation matches the frequency of the bond or group that vibrates. The energies are determined by the shape of the molecular potential energy surfaces, the masses of the atoms, and the associated vibronic coupling.
In particular, in the Born'Oppenheimer and harmonic approximations, i.e. when the molecular Hamiltonian corresponding to the electronic ground state can be approximated by a harmonic oscillator in the neighborhood of the equilibrium molecular geometry, the resonant frequencies are determined by the normal modes corresponding to the molecular electronic ground state potential energy surface. Nevertheless, the resonant frequencies can be in a first approach related to the strength of the bond, and the mass of the atoms at either end of it. Thus, the frequency of the vibrations can be associated with a particular bond type.
[edit] Number of vibrational modes
In order for a vibrational mode in a molecule to be "IR active," it must be associated with changes in the permanent dipole.
A molecule can vibrate in many ways, and each way is called a vibrational mode. Linear molecules have 3N'5 degrees of vibrational modes whereas nonlinear molecules have 3N'6 degrees of vibrational modes (also called vibrational degrees of freedom). As an example H2O, a non-linear molecule, will have 3×3'6 = 3 degrees of vibrational freedom, or modes.
Simple diatomic molecules have only one bond and only one vibrational band. If the molecule is symmetrical, e.g. N2, the band is not observed in the IR spectrum, but only in the Raman spectrum. Unsymmetrical diatomic molecules, e.g. CO, absorb in the IR spectrum. More complex molecules have many bonds, and their vibrational spectra are correspondingly more complex, i.e. big molecules have many peaks in their IR spectra.
The atoms in a CH2 group, commonly found in organic compounds, can vibrate in six different ways: symmetric and antisymmetric stretching, scissoring, rocking, wagging and twisting:
| Symmetrical stretching |
Antisymmetrical stretching |
Scissoring |
|---|---|---|
 |
 |
 |
| Rocking | Wagging | Twisting |
 |
 |
 |
(These figures do not represent the "recoil" of the C atoms, which however, though necessarily present to balance the overall movements of the molecule, are much smaller than the movements of the lighter H atoms).
[edit] Special effects
The simplest and most important IR bands arise from the "normal modes," the simplest distortions of the molecule. In some cases, "overtone bands" are observed. These bands arise from the absorption of a photon that leads to a doubly excited vibrational state. Such bands appear at approximately twice the energy of the normal mode. Some vibrations, so-called 'combination modes," involve more than one normal mode. The phenomenon of Fermi resonance can arise when two modes are similar in energy, Fermi resonance results in an unexpected shift in energy and intensity of the bands.
[edit] Practical IR spectroscopy
The infrared spectrum of a sample is recorded by passing a beam of infrared light through the sample. Examination of the transmitted light reveals how much energy was absorbed at each wavelength. This can be done with a monochromatic beam, which changes in wavelength over time, or by using a Fourier transform instrument to measure all wavelengths at once. From this, a transmittance or absorbance spectrum can be produced, showing at which IR wavelengths the sample absorbs. Analysis of these absorption characteristics reveals details about the molecular structure of the sample. When the frequency of the IR is the same as the vibrational frequency of a bond, absorption occurs.
This technique works almost exclusively on samples with covalent bonds. Simple spectra are obtained from samples with few IR active bonds and high levels of purity. More complex molecular structures lead to more absorption bands and more complex spectra. The technique has been used for the characterization of very complex mixtures.
[edit] Sample preparation
Gaseous samples require a sample cell with a long pathlength (typically 5'10 cm), to compensate for the diluteness.
Liquid samples can be sandwiched between two plates of a salt (commonly sodium chloride, or common salt, although a number of other salts such as potassium bromide or calcium fluoride are also used).[1] The plates are transparent to the infrared light and do not introduce any lines onto the spectra.
Solid samples can be prepared in a variety of ways. One common method is to crush the sample with an oily mulling agent (usually Nujol) in a marble or agate mortar, with a pestle. A thin film of the mull is smeared onto salt plates and measured. The second method is to grind a quantity of the sample with a specially purified salt (usually potassium bromide) finely (to remove scattering effects from large crystals). This powder mixture is then pressed in a mechanical press to form a translucent pellet through which the beam of the spectrometer can pass.[1] A third technique is the "cast film" technique, which is used mainly for polymeric materials. The sample is first dissolved in a suitable, non hygroscopic solvent. A drop of this solution is deposited on surface of KBr or NaCl cell. The solution is then evaporated to dryness and the film formed on the cell is analysed directly. Care is important to ensure that the film is not too thick otherwise light cannot pass through. This technique is suitable for qualitative analysis. The final method is to use microtomy to cut a thin (20'100 –m) film from a solid sample. This is one of the most important ways of analysing failed plastic products for example because the integrity of the solid is preserved.
It is important to note that spectra obtained from different sample preparation methods will look slightly different from each other due to differences in the samples' physical states.
[edit] Comparing to a reference

To take the infrared spectrum of a sample, it is necessary to measure both the sample and a "reference" (or "control"). This is because each measurement is affected by not only the light-absorption properties of the sample, but also the properties of the instrument (for example, what light source is used, what detector is used, etc.). The reference measurement makes it possible to eliminate the instrument influence. Mathematically, the sample transmission spectrum is divided by the reference transmission spectrum.
The appropriate "reference" depends on the measurement and its goal. The simplest reference measurement is to simply remove the sample (replacing it by air). However, sometimes a different reference is more useful. For example, if the sample is a dilute solute dissolved in water in a beaker, then a good reference measurement might be to measure pure water in the same beaker. Then the reference measurement would cancel out not only all the instrumental properties (like what light source is used), but also the light-absorbing and light-reflecting properties of the water and beaker, and the final result would just show the properties of the solute (at least approximately).
A common way to compare to a reference is sequentially: First measure the reference, then replace the reference by the sample, then measure the sample. This technique is not perfectly reliable: If the infrared lamp is a bit brighter during the reference measurement, then a bit dimmer during the sample measurement, the measurement will be distorted. More elaborate methods, such as a "two-beam" setup (see figure), can correct for these types of effects to give very accurate results.
[edit] FTIR

Fourier transform infrared (FTIR) spectroscopy is a measurement technique that allows one to record infrared spectra. Infrared light is guided through an interferometer and then through the sample (or vice versa). A moving mirror inside the apparatus alters the distribution of infrared light that passes through the interferometer. The signal directly recorded, called an "interferogram", represents light output as a function of mirror position. A data-processing technique called Fourier transform turns this raw data into the desired result (the sample's spectrum): Light output as a function of infrared wavelength (or equivalently, wavenumber). As described above, the sample's spectrum is always compared to a reference.
There is an alternate method for taking spectra (the "dispersive" or "scanning monochromator" method), where one wavelength at a time passes through the sample. The dispersive method is more common in UV-Vis spectroscopy, but is less practical in the infrared than the FTIR method. One reason that FTIR is favored is called "Fellgett's advantage" or the "multiplex advantage": The information at all frequencies is collected simultaneously, improving both speed and signal-to-noise ratio. Another is called "Jacquinot's Throughput Advantage": A dispersive measurement requires detecting much lower light levels than an FTIR measurement.[2] There are other advantages, as well as some disadvantages,[2] but virtually all modern infrared spectrometers are FTIR instruments.
[edit] Absorption bands

Wavenumbers listed in cm'1.
[edit] Uses and applications
Infrared spectroscopy is widely used in both research and industry as a simple and reliable technique for measurement, quality control and dynamic measurement. It is also used in forensic analysis in both criminal and civil cases, enabling identification of polymer degradation for example.
The instruments are now small, and can be transported, even for use in field trials. With increasing technology in computer filtering and manipulation of the results, samples in solution can now be measured accurately (water produces a broad absorbance across the range of interest, and thus renders the spectra unreadable without this computer treatment). Some instruments will also automatically tell you what substance is being measured from a store of thousands of reference spectra held in storage.
By measuring at a specific frequency over time, changes in the character or quantity of a particular bond can be measured. This is especially useful in measuring the degree of polymerization in polymer manufacture. Modern research instruments can take infrared measurements across the whole range of interest as frequently as 32 times a second. This can be done whilst simultaneous measurements are made using other techniques. This makes the observations of chemical reactions and processes quicker and more accurate.
Infrared spectroscopy has been highly successful for applications in both organic and inorganic chemistry. Infrared spectroscopy has also been successfully utilized in the field of semiconductor microelectronics:[3] for example, infrared spectroscopy can be applied to semiconductors like silicon, gallium arsenide, gallium nitride, zinc selenide, amorphous silicon, silicon nitride, etc.
[edit] Isotope effects
The different isotopes in a particular species may give fine detail in infrared spectroscopy. For example, the O-O stretching frequency (in reciprocal centimeters) of oxyhemocyanin is experimentally determined to be 832 and 788 cm'1 for î�(16O-16O) and î�(18O-18O), respectively.
By considering the O-O as a spring, the wavenumber of absorbance, î� can be calculated:
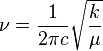
where k is the spring constant for the bond, c is the speed of light, and î� is the reduced mass of the A-B system:
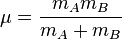
(mi is the mass of atom i).
The reduced masses for 16O-16O and 18O-18O can be approximated as 8 and 9 respectively. Thus
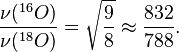
Where î� is the wavenumber; [wavenumber = frequency/(speed of light)]
The effect of isotopes, both on the vibration and the decay dynamics, has been found to be stronger than previously thought. In some systems, such as silicon and germanium, the decay of the anti-symmetric stretch mode of interstitial oxygen involves the symmetric stretch mode with a strong isotope dependence. For example, it was shown that for a natural silicon sample, the lifetime of the anti-symmetric vibration is 11.4 ps. When the isotope of one of the silicon atoms is increased to 29Si, the lifetime increases to 19 ps. In similar manner, when the silicon atom is changed to 30Si, the lifetime becomes 27 ps.[4]
[edit] Two-dimensional IR
Two-dimensional infrared correlation spectroscopy analysis is the application of 2D correlation analysis on infrared spectra. By extending the spectral information of a perturbed sample, spectral analysis is simplified and resolution is enhanced. The 2D synchronous and 2D asynchronous spectra represent a graphical overview of the spectral changes due to a perturbation (such as a changing concentration or changing temperature) as well as the relationship between the spectral changes at two different wavenumbers.

Nonlinear two-dimensional infrared spectroscopy[5][6] is the infrared version of correlation spectroscopy. Nonlinear two-dimensional infrared spectroscopy is a technique that has become available with the development of femtosecond infrared laser pulses. In this experiment, first a set of pump pulses are applied to the sample. This is followed by a waiting time, wherein the system is allowed to relax. The typical waiting time lasts from zero to several picoseconds, and the duration can be controlled with a resolution of tens of femtoseconds. A probe pulse is then applied resulting in the emission of a signal from the sample. The nonlinear two-dimensional infrared spectrum is a two-dimensional correlation plot of the frequency ω1 that was excited by the initial pump pulses and the frequency ω3 excited by the probe pulse after the waiting time. This allows the observation of coupling between different vibrational modes; because of its extremely high time resolution, it can be used to monitor molecular dynamics on a picosecond timescale. It is still a largely unexplored technique and is becoming increasingly popular for fundamental research.
As with two-dimensional nuclear magnetic resonance (2DNMR) spectroscopy, this technique spreads the spectrum in two dimensions and allows for the observation of cross peaks that contain information on the coupling between different modes. In contrast to 2DNMR, nonlinear two-dimensional infrared spectroscopy also involves the excitation to overtones. These excitations result in excited state absorption peaks located below the diagonal and cross peaks. In 2DNMR, two distinct techniques, COSY and NOESY, are frequently used. The cross peaks in the first are related to the scalar coupling, while in the later they are related to the spin transfer between different nuclei. In nonlinear two-dimensional infrared spectroscopy, analogs have been drawn to these 2DNMR techniques. Nonlinear two-dimensional infrared spectroscopy with zero waiting time corresponds to COSY, and nonlinear two-dimensional infrared spectroscopy with finite waiting time allowing vibrational population transfer corresponds to NOESY. The COSY variant of nonlinear two-dimensional infrared spectroscopy has been used for determination of the secondary structure content proteins.[7]
[edit] See also
[edit] References
- ^ a b Laurence M. Harwood, Christopher J. Moody (1989). Experimental organic chemistry: Principles and Practice (Illustrated ed.). Wiley-Blackwell. p. 292. ISBN 0632020172.
- ^ a b Chromatography/Fourier transform infrared spectroscopy and its applications, by Robert White, p7
- ^ Lau, W.S. (1999). Infrared characterization for microelectronics. World Scientific. ISBN 9810223528. http://books.google.com/?id=rotNlJDFJWsC&printsec=frontcover.
- ^ Kohli, K.; Davies, Gordon; Vinh, N.; West, D.; Estreicher, S.; Gregorkiewicz, T.; Izeddin, I.; Itoh, K. (2006). "Isotope Dependence of the Lifetime of the 1136-cm-1 Vibration of Oxygen in Silicon". Physical Review Letters 96 (22): 225503. doi:10.1103/PhysRevLett.96.225503. PMID 16803320.
- ^ P. Hamm, M. H. Lim, R. M. Hochstrasser (1998). "Structure of the amide I band of peptides measured by femtosecond nonlinear-infrared spectroscopy". J. Phys. Chem. B 102: 6123. doi:10.1021/jp9813286.
- ^ S. Mukamel (2000). "Multidimensional Fentosecond Correlation Spectroscopies of Electronic and Vibrational Excitations". Annual Review of Physics and Chemistry 51: 691. doi:10.1146/annurev.physchem.51.1.691. PMID 11031297.
- ^ N. Demirdöven, C. M. Cheatum, H. S. Chung, M. Khalil, J. Knoester, A. Tokmakoff (2004). "Two-dimensional infrared spectroscopy of antiparallel beta-sheet secondary structure". Journal of the American Chemical Society 126 (25): 7981. doi:10.1021/ja049811j. PMID 15212548.
[edit] External links
| Wikimedia Commons has media related to: Infrared spectroscopy |
- A useful gif animation of different vibrational modes: SHU.ac.uk
- Infrared spectroscopy for organic chemists
- Organic compounds spectrum database
|
SOURCES.COM is an online portal and directory for journalists, news media, researchers and anyone seeking experts, spokespersons, and reliable information resources. Use SOURCES.COM to find experts, media contacts, news releases, background information, scientists, officials, speakers, newsmakers, spokespeople, talk show guests, story ideas, research studies, databases, universities, associations and NGOs, businesses, government spokespeople. Indexing and search applications by Ulli Diemer and Chris DeFreitas.
For information about being included in SOURCES as a expert or spokesperson see the FAQ . For partnerships, content and applications, and domain name opportunities contact us.