
| Home | Sources Directory | News Releases | Calendar | Articles | | Contact | |
Genetic drift
| Part of the Biology series on |
| Evolution |
 |
| Mechanisms and processes |
|---|
|
Adaptation |
| Research and history |
|
Introduction |
| Evolutionary biology fields |
|
Cladistics |
| Biology portal – |
Genetic drift or allelic drift is the change in the frequency of a gene variant (allele) in a population due to random sampling. The alleles in the offspring are a sample of those in the parents, and chance has a role in determining whether a given individual survives and reproduces. A population's allele frequency is the fraction of the copies of one gene that share a particular form.[1]
Genetic drift is an important evolutionary process, which leads to changes in allele frequencies over time. It may cause gene variants to disappear completely, and thereby reduce genetic variation. In contrast to natural selection, which makes gene variants more common or less common depending on their reproductive success,[2] the changes due to genetic drift are not driven by environmental or adaptive pressures, and may be beneficial, neutral, or detrimental to reproductive success.
The effect of genetic drift is larger in small populations, and smaller in large populations. Vigorous debates wage among scientists over the relative importance of genetic drift compared with natural selection. Ronald Fisher held the view that genetic drift plays at the most a minor role in evolution, and this remained the dominant view for several decades. In 1968 Motoo Kimura rekindled the debate with his neutral theory of molecular evolution which claims that most of the changes in the genetic material (although not necessarily changes in phenotypes) are caused by genetic drift.[3]
Contents |
[edit] Analogy with marbles in a jar
The process of genetic drift can be illustrated using 20 marbles in a jar to represent 20 organisms in a population.[4] Half of them are red and half blue, and both colors correspond to two different alleles of one gene in the population. In each new generation the organisms reproduce at random. To represent this reproduction, randomly select a marble from the original jar and deposit a new marble with the same color as its "parent" into a new jar. (The selected marble remains in the original jar.) Repeat this process until there are 20 new marbles in the second jar. The second jar will then contain a second generation of "offspring", consisting of 20 marbles of various colors. Unless the second jar contains exactly 10 red and 10 blue marbles, there will have been a random shift in the allele frequencies.
Repeat this process a number of times, randomly reproducing each generation of marbles to form the next. The numbers of red and blue marbles picked each generation will fluctuate: sometimes more red, sometimes more blue. This fluctuation is genetic drift ' a change in the population's allele frequency resulting from a random variation in the distribution of alleles from one generation to the next.
It is even possible that in any one generation no marbles of a particular color will be chosen, meaning they have no offspring. In this example, if no red marbles are selected the jar representing the new generation will contain only blue offspring. If this happens, the red allele has been lost permanently in the population, while the remaining blue allele has become fixed: all future generations will be entirely blue. In small populations, fixation can occur in just a few generations. Given enough time, this outcome is nearly inevitable for populations of any size.

[edit] Probability and allele frequency
In probability theory, the law of large numbers predicts little change taking place over time when the population is large. When the reproductive population is small, however, the effects of sampling error can alter the allele frequencies significantly. Genetic drift is therefore considered to be a consequential mechanism of evolutionary change primarily within small, isolated populations.[5]
This effect can be illustrated using a simplified example. Consider a very large colony of bacteria which are isolated within a drop of solution. The bacteria are genetically identical except for a single gene for which there are two different alleles. The alleles are labeled A and B. Half of the bacteria have allele A and the other half have allele B. Thus both A and B have allele frequency 1/2.
A and B are neutral alleles, meaning they do not affect the bacteria's ability to survive and reproduce. This being the case, all bacteria in this colony are equally likely to survive and reproduce. The drop of solution then shrinks until it has only enough food to sustain four bacteria. All the others die without reproducing. Among the four who survive, there are sixteen possible combinations for the A and B alleles:
(A-A-A-A), (B-A-A-A), (A-B-A-A), (B-B-A-A),
(A-A-B-A), (B-A-B-A), (A-B-B-A), (B-B-B-A),
(A-A-A-B), (B-A-A-B), (A-B-A-B), (B-B-A-B),
(A-A-B-B), (B-A-B-B), (A-B-B-B), (B-B-B-B).
If each of the combinations with the same number of A and B respectively are counted, we get the following table. The probabilities are calculated with the slightly faulty premise that the peak population size was infinite.
| A | B | Combinations | Probability |
| 4 | 0 | 1 | 1/16 |
| 3 | 1 | 4 | 4/16 |
| 2 | 2 | 6 | 6/16 |
| 1 | 3 | 4 | 4/16 |
| 0 | 4 | 1 | 1/16 |
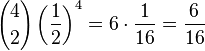
The probability of any one possible combination is

where 1/2 (the probability of the A or B allele for each surviving bacterium) is multiplied four times (the total sample size, which in this example is the total number of surviving bacteria).
As seen in the table, the total number of possible combinations to have an equal (conserved) number of A and B alleles is six, and its probability is 6/16. The total number of possible alternative combinations is ten, and the probability of unequal number of A and B alleles is 10/16.
The total number of possible combinations can be represented as binomial coefficients and they can be derived from Pascal's triangle. The probability for any one of the possible combinations can be calculated with the formula

where N is the number of bacteria and k is the number of A (or B) alleles in the combination. The function '()' signifies the binomial coefficient and can be expressed as "N choose k". Using the formula to calculate the probability that between them the surviving four bacteria have two A alleles and two B alleles.[6]
Genetic drift occurs when a population's allele frequencies change due to random events. In this example the population contracted to just four random survivors, a phenomenon known as population bottleneck. The original colony began with an equal distribution of A and B alleles but chances are that the remaining population of four members has an unequal distribution. There is a higher probability that this surviving population will undergo drift (10/16) than the probability it will remain the same (6/16).
[edit] Wright-Fisher model
The example given uses bacteria to illustrate the effect of sampling and probability in genetic drift. Each bacterium has a single allele, A or B. In diploid populations consisting of N individuals there are 2N copies of each gene. An individual can have two copies of the same allele or two different alleles. We can call the frequency of one allele p and the frequency of the other q. The Wright-Fisher model assumes that generations do not overlap. For example, annual plants have exactly one generation per year. Each copy of the gene found in the new generation is drawn independently at random from all copies of the gene in the old generation. The formula to calculate the probability of obtaining k copies of an allele that had frequency p in the last generation is then[7]

where the symbol "!" signifies the factorial function. This expression can also be formulated using the binomial coefficient,

[edit] Moran model
The Moran model assumes overlapping generations. At each time step, one individual is chosen to reproduce and one individual is chosen to die. So in each timestep, the number of copies of a given allele can go up by one, go down by one, or can stay the same. This means that the transition matrix is tridiagonal, which means that mathematical solutions are easier for the Moran model than for the Wright-Fisher model. On the other hand, computer simulations are usually easier to perform using the Wright-Fisher model, because fewer time steps need to be calculated. In the Moran model, it takes N timesteps to get through one generation, where N is the effective population size. In the Wright-Fisher model, it takes just one.
In practice, the Moran model and Wright-Fisher model give qualitatively similar results, but genetic drift runs twice as fast in the Moran model.
[edit] Random effects other than sampling error
Random changes in allele frequencies can also be caused by other effects than sampling error, for example random changes in selection pressure.[8]
One important alternative source of stochasticity, perhaps more important than genetic drift, is genetic draft.[9] Genetic draft describes the way the fate of a new mutation depends on the luck of which other alleles happen to be nearby at linked loci. Genetic draft has very different mathematical properties; unlike genetic drift, the direction of the random change in allele frequency each generation is strongly autocorrelated instead of independent over time.
[edit] Drift and fixation
The Hardy'Weinberg principle states that within sufficiently large, randomly mating populations the allele frequencies will tend to remain constant from one generation to the next unless the equilibrium is disturbed by migration, genetic mutation, or selection.[10] However, there is no residual influence on this probability from the frequency distribution of alleles in the grandparent, or any earlier, population'only that of the parent population. The predicted distribution of alleles among the offspring is a memory-less probability as described in the Markov property. This means that the mathematical probabilities associated with the distribution of alleles in any generation are only derived from the distribution of alleles in the generation immediately prior. Thus when random fluctuations result in a change of the allele frequency from the parent generation to the offspring generation, that deviation establishes new expected values for the allele distributions in the next generation to follow.[11]
Populations do not gain new alleles from the random sampling of alleles passed to the next generation, but the sampling can cause an existing allele to disappear. Because random sampling can remove but not replace an allele, and because random declines or increases in allele frequency will influence the expected allele distributions for the next following generation, genetic drift drives a population towards genetic uniformity over time. When an allele reaches a frequency of 1 (100%) it is said to be "fixed" in the population and when an allele reaches a frequency of 0 (0%) it is lost. Once an allele becomes fixed, genetic drift comes to a halt, and the allele frequency cannot change unless a new allele is introduced in the population via mutation or gene flow. Thus even while genetic drift is a random, directionless process, it acts to eliminate genetic variation over time.[12]
[edit] Time to fixation or loss

Assuming genetic drift is the only evolutionary force acting upon an allele, at any given point in time the probability that an allele will eventually become fixed in the population is simply its frequency in the population at that given point in time.[13] For example, if the frequency p for allele A is 75% and the frequency q for allele B is 25%, then given unlimited time the probability A will ultimately become fixed in the population is 75% and the probability that B becomes fixed is 25%.
The time needed, which is measured by the number of generations, for fixation to occur can be estimated with probability, and is proportional to the population size, such that fixation is predicted to occur much more rapidly in smaller populations.[14] Normally the effective population size, which is smaller than the total population, is used to determine these probabilities. The effective population size (Ne) takes into account factors such as the level of inbreeding, the number of organisms that are too old or young to breed, and the lower probability that two organisms that live far apart will reproduce.[15]
One forward-looking formula used for approximating the time needed for a neutral allele to become fixed through genetic drift, according to the Wright-Fisher model, is

where T is the number of generations, Ne is the effective population size, and p is the initial frequency for the given allele. The result is the number of generations expected to pass before fixation occurs for a given allele in a population with given size (Ne) and allele frequency (p).[16]
The expected time for the neutral allele to be lost through genetic drift can be calculated as[17]
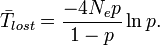
These calculations are also used to understand the impact genetic drift will have on a new allele introduced through genetic mutation. In estimating the drift of a neutral mutation in a large population, (which can be assumed to begin as a single occurrence of the allele and thus its initial frequency will be negligible), the formulas can be simplified to[18]

for average number of generations needed for fixation of a neutral mutation, and

for the average number of generations needed for the loss of a neutral mutation.[19] In cases where Ne and N are assumed to be equal, the ratio of time-to-fixation over time-to-loss is[16]

[edit] Genetic drift versus natural selection
Although both processes drive evolution, genetic drift operates randomly while natural selection functions non-randomly. This is because natural selection emblematizes the ecological interaction of a population, whereas drift is regarded as a sampling procedure across successive generations without regard to fitness pressures imposed by the environment. While natural selection is directioned, guiding evolution by impelling heritable adaptations to the environment, genetic drift has no direction and is guided only by the mathematics of chance.[20]
As a result, drift acts upon the genotypic frequencies within a population without regard their relationship to the phenotype. Changes to the genotype caused by genetic drift may or may not result in changes to the phenotype. In drift each allele in a population is randomly and independently affected, yet the fluctuations in their allele frequencies are all driven in a quantitatively similar manner. Drift is blind with respect to any advantage or disadvantage the allele may bring. Alternatively, natural selection acts directly on the phenotype and indirectly on its underlying genotype. Selection responds specifically to the adaptive advantage or disadvantage presented by a phenotypic trait, and thus affects genes differentially. Selection indirectly rewards the alleles that develop adaptively advantageous phenotypes; with an increase in reproductive success for the phenotype comes an increase in allele frequency. By the same token, selection lowers the frequencies for alleles that cause unfavorable traits, and ignores those which are neutral.[21]
In natural populations, genetic drift and natural selection do not act in isolation; both forces are always at play. However, the degree to which alleles are affected by drift or selection varies according to population size. The statistical effect of sampling error during the reproduction of alleles is much greater in small populations than in large ones. When populations are very small, drift will predominate, and may preserve unfavorable alleles and eliminate favorable ones (this means purifying selection has a stronger effect in species with a larger effective population[22]). Weak selective effects may not be seen at all, as the small changes in frequency they would produce are overshadowed by drift.[23]
In a large population, the probability of sampling error is small and little change to the allele frequencies is expected, even over many generations. Even weak selection forces acting upon an allele will push its frequency upwards or downwards (depending on whether the allele's influence is beneficial or harmful). However, in cases where the allele frequency is very small, drift can also overpower selection'even in large populations. For example, while disadvantageous mutations are usually eliminated quickly in large populations, new advantageous mutations are almost as vulnerable to loss through genetic drift as are neutral mutations. It is not until the allele frequency for the advantageous mutation reaches a certain threshold that genetic drift will have little effect.[21]
Most mutations have a clear negative selective effect and cause the gametes that they occur in to disappear after a few generations. It is possible to calculate how many percent of each generation will be removed by such mutations. The size of the remaining population, is said to be a factor f0, the equilibrium frequency of non-deleterious alleles, times the total population (f0 is between zero and one). When a neutral mutation spreads by drift in a population, some of the occurrencies will be removed because they are linked to such negative mutations. That is, they are located in chromosomes that are removed because of selection against a mutation in another part of the same chromosome. As a consequence, the effective population size is reduced by the factor f0. This means that mutation and selection in combination, causes the drift to have more effect. Because strength of genetic linkage varies along the chromosome, effective population size, and thereby genetic drift, also varies. With a higher recombination rate, linkage decreases and with it this local effect on drift.[24][25] This effect is visible in molecular data as a correlation between local recombination rate and genetic diversity,[26] and negative correlation between gene density and diversity at noncoding sites.[27]
[edit] Population bottleneck

A population bottleneck is when a population contracts to a significantly smaller size over a short period of time due to some random environmental event.[28] In a true population bottleneck, the odds for survival of any member of the population are purely random, and are not improved by any particular inherent genetic advantage. The bottleneck can result in radical changes in allele frequencies, completely independent of selection. And its impact can be sustained, even when the bottleneck is caused by a one-time event such as a natural catastrophe. Even when the allele frequency of the original population is carried forward in the surviving population, a radical reduction in population size increases the likelihood of further allele fluctuation from drift in generations to come.
A population's genetic variation can be greatly reduced by a bottleneck, and even beneficial adaptations may be permanently eliminated.[29] The loss of variation leaves the surviving population vulnerable to any new selection pressures such as disease, climate change or shift in the available food source, because adapting in response to environmental changes requires sufficient genetic variation in the population for natural selection to take place.[30][31]
There have been many known cases of population bottleneck in the recent past. Prior to the arrival of Europeans, North American prairies were habitat for millions of greater prairie chickens. In Illinois alone, their numbers plummeted from about 100 million birds in 1900 to about 50 birds in the 1990s. The declines in population resulted from hunting and habitat destruction, but the random consequence has been a loss of most of the species' genetic diversity. DNA analysis comparing birds from the mid century to birds in the 1990s documents a steep decline in the genetic variation in just in the latter few decades. Currently the greater prairie chicken is experiencing low reproductive success.[32]
Over-hunting also caused a severe population bottleneck in the northern elephant seal in the 19th century. Their resulting decline in genetic variation can be deduced by comparing it to that of the southern elephant seal which were not so aggressively hunted.[33]
[edit] Founder effect

The founder effect is a special case of genetic drift, occurring when a small group in a population splinters off from the original population and forms a new one. The random sample of alleles in the just formed new colony is expected to grossly misrepresent the original population in at least some respects.[34] It is even possible that the number of alleles for some genes in the original population is larger than the number of gene copies in the founders, making complete representation impossible. When a newly formed colony is small, its founders can strongly affect the population's genetic make-up far into the future.
A well documented example is found in the Amish migration to Pennsylvania in 1744. Two members of the new colony shared the recessive allele for Ellis'van Creveld syndrome. Members of the colony and their descendants tend to be religious isolates and remain relatively insular. As a result of many generations of inbreeding, Ellis-van Creveld syndrome is now much more prevalent among the Amish than in the general population.[21][35]
The difference in gene frequencies between the original population and colony may also trigger the two groups to diverge significantly over the course of many generations. As the difference, or genetic distance, increases, the two separated populations may become distinct, both genetically and phenetically, although not only genetic drift but also natural selection, gene flow and mutation will all contribute to this divergence. This potential for relatively rapid changes in the colony's gene frequency led most scientists to consider the founder effect (and by extension, genetic drift) a significant driving force in the evolution of new species. Sewall Wright was the first to attach this significance to random drift and small, newly isolated populations with his shifting balance theory of speciation.[36] Following after Wright, Ernst Mayr created many persuasive models to show that the decline in genetic variation and small population size following the founder effect were critically important for new species to develop.[37] However, there is much less support for this view today since the hypothesis has been tested repeatedly through experimental research and the results have been equivocal at best.[38]
[edit] History of the concept
The concept for genetic drift was first introduced by one of the founders in the field of population genetics, Sewall Wright. His first use of the term "drift" was in 1929,[39] though at the time he was using it in the sense of a directed process of change, or natural selection. Later that year he used it to refer to a purely random process, or change due to the effects of sampling error. It came to be known as the "Sewall-Wright effect", though he was never entirely comfortable to see his name given to it. He preferred "drifting at random", and "drift" came to be adopted as a technical term in the stochastic sense exclusively.[40]
In the early days of the modern evolutionary synthesis, scientists were just beginning to blend the new science of population genetics with Charles Darwin's theory of natural selection. Working within this new framework, Wright focused on the effects of inbreeding on small relatively isolated populations. He introduced the concept of an adaptive landscape in which phenomena such as cross breeding and genetic drift in small populations could push them away from adaptive peaks, which would in turn allow natural selection to push them towards new adaptive peaks.[41] Wright thought smaller populations were more suited for natural selection because "inbreeding was sufficiently intense to create new interaction systems through random drift but not intense enough to cause random nonadaptive fixation of genes."[40]
Wright's views on the role of genetic drift in the evolutionary scheme were controversial almost from the very beginning. One of the most vociferous and influential critics was colleague Ronald Fisher. Fisher conceded genetic drift played some role in evolution, but an insignificant one. Fisher has been accused of misunderstanding Wright's views because in his criticisms Fisher seemed to argue Wright had rejected selection almost entirely. To Fisher, viewing the process of evolution as a long, steady, adaptive progression was the only way to explain the ever increasing complexity from simpler forms. But the debates have continued between the "gradualists" and those who lean more toward the Wright model of evolution where selection and drift together play an important role.[2]
In 1968,[42] population geneticist Motoo Kimura rekindled the debate with his neutral theory of molecular evolution, which claims that most of the genetic changes are caused by genetic drift acting on neutral mutations.[3]
[edit] See also
[edit] Notes
- ^ Futuyma, Douglas (1998). Evolutionary Biology. Sinauer Associates. p. Glossary. ISBN 0-87893-189-9.
- ^ a b Avers, Charlotte (1989). Process and Pattern in Evolution. Oxford University Press.
- ^ a b Futuyma, Douglas (1998). Evolutionary Biology. Sinauer Associates. p. 320. ISBN 0-87893-189-9.
- ^ "Evolution 101:Sampling Error and Evolution". University of California Berkeley. http://evolution.berkeley.edu/evosite/evo101/IIID1Samplingerror.shtml. Retrieved 2009-11-01.
- ^ Zimmer, Carl (2002). Evolution : The Triumph of an Idea. New York, NY: Perennial. pp. 364. ISBN 0-06-095850-2.
- ^ Walker J. "Introduction to Probability and Statistics". The RetroPsychoKinesis Project. Fourmilab. http://www.fourmilab.ch/rpkp/experiments/statistics.html. Retrieved 2009-11-17.
- ^ Hartl, Daniel (2007). Principles of Population Genetics. Sinauer Associates. p. 102. ISBN 978-0-87893-308-2.
- ^ Li, Wen-Hsiung; Dan Graur (1991). Fundamentals of Molecular Evolution. Sinauer Associates. p. 28. ISBN 0-87893-452-9.
- ^ Gillespie, John H. (2001). "Is the population size of a species relevant to its evolution?". Evolution 55 (11): 2161'2169.
- ^ Hartwell el al, Leland (2004). Genetics: From Genes to Genomes; 2nd edition. McGraw Hill. p. 680. ISBN 0-07-246248-5.
- ^ Hartl, Daniel; Andrew Clark (2007). Principles of Population Genetics. Sinauer Associates. p. 102. ISBN 978-0-87893-308-2.
- ^ Li, Wen-Hsiung; Dan Graur (1991). Fundamentals of Molecular Evolution. Sinauer Associates. p. 29. ISBN 0-87893-452-9.
- ^ Futuyma, Douglas (1998). Evolutionary Biology. Sinauer Associates. p. 300. ISBN 0-87893-189-9.
- ^ Otto S, Whitlock M (1 June 1997). "The probability of fixation in populations of changing size". Genetics 146 (2): 723'33. PMID 9178020. PMC 1208011. http://www.pubmedcentral.nih.gov/articlerender.fcgi?tool=pubmed&pubmedid=9178020.
- ^ Charlesworth B (March 2009). "Fundamental concepts in genetics: Effective population size and patterns of molecular evolution and variation". Nat. Rev. Genet. 10 (3): 195'205. doi:10.1038/nrg2526. PMID 19204717.
- ^ a b Hedrick, Philip W. (2004). Genetics of Populations. Jones and Bartlett Publishers. pp. 737. ISBN 0763747726.
- ^ Daniel Hartl, Andrew Clark (2007). Principles of Population Genetics, 4th edition. Sinauer Associates. p. 112. ISBN 978-0-87893-308-2.
- ^ Wen-Hsiung Li, Dan Graur (1991). Fundamentals of Molecular Evolution. Sinauer Associates. p. 33. ISBN 978-0-87893-452-9.
- ^ Kimura, Motoo; Ohta, Tomoko (2001). Theoretical Aspects of Population Genetics. Princeton University Press. pp. 232. ISBN 0691080984.
- ^ "Natural Selection: How Evolution Works (An interview with Douglas Futuyma, see answer to question Is natural selection the only mechanism of evolution?)". ActionBioscience.org. http://www.actionbioscience.org/evolution/futuyma.html. Retrieved 2009-11-24.
- ^ a b c Cavalli-Sforza, L. L.; Menozzi, Paolo; Piazza, Alberto (1996). The history and geography of human genes. Princeton, N.J.: Princeton University Press. pp. 413. ISBN 0-691-02905-9.
- ^ Small KS, Brudno M, Hill MM, Sidow A (March 2007). "Extreme genomic variation in a natural population". Proc. Natl. Acad. Sci. U.S.A. 104 (13): 5698'703. doi:10.1073/pnas.0700890104. PMID 17372217. PMC 1838466. http://www.pnas.org/content/104/13/5698.long.
- ^ Simpson, George Gaylord (1967). The Meaning of Evolution (Second ed.). Yale University Press.
- ^ Golding B (1994). Non-neutral evolution: theories and molecular data. Springer. pp. 46. ISBN 978-0-412-05391-7.
- ^ Charlesworth B, Morgan MT, Charlesworth D (August 1993). "The effect of deleterious mutations on neutral molecular variation". Genetics 134 (4): 1289'303. PMID 8375663. PMC 1205596. http://www.genetics.org/cgi/reprint/134/4/1289.
- ^ Presgraves DC (September 2005). "Recombination enhances protein adaptation in Drosophila melanogaster". Curr. Biol. 15 (18): 1651'6. doi:10.1016/j.cub.2005.07.065. PMID 16169487.
- ^ Nordborg M, Hu TT, Ishino Y, et al. (July 2005). "The pattern of polymorphism in Arabidopsis thaliana". PLoS Biol. 3 (7): e196. doi:10.1371/journal.pbio.0030196. PMID 15907155.
- ^ Population Bottleneck | Macmillan Genetics
- ^ Futuyma, Douglas (1998). Evolutionary Biology. Sinauer Associates. pp. 303'304. ISBN 0-87893-189-9.
- ^ O'Corry-Crowe G (2008). "Climate change and the molecular ecology of arctic marine mammals". Ecological Applications 18 (2 Suppl): S56'S76. doi:10.1890/06-0795.1. PMID 18494363. http://www.esajournals.org/doi/full/10.1890/06-0795.1.
- ^ Cornuet JM, Luikart G (1996). "Description and power analysis of two tests for detecting recent population bottlenecks from allele frequency data". Genetics 144 (4): 2001'14. PMID 8978083.
- ^ Hillis, David M.; Sadava, David E.; Heller, Craig H.; Orians, Gordon H.; Purves, William K. (2006). "Chs. 1, 21'33, 52'57". Life: The Science of Biology. II: Evolution, Diversity and Ecology. San Francisco: W. H. Freeman. pp. 1251. ISBN 9780716798569.
- ^ "Evolution 101: Bottlenecks and Founder Effects". University of California, Berkeley. http://evolution.berkeley.edu/evosite/evo101/IIID3Bottlenecks.shtml. Retrieved 2009-04-07.
- ^ Neill, Campbell (1996). Biology; Fourth edition. The Benjamin/Cummings Publishing Company. p. 423. ISBN 0-8053-1940-9.
- ^ "Genetic Drift and the Founder Effect". Evolution. Public Broadcast System. http://www.pbs.org/wgbh/evolution/library/06/3/l_063_03.html. Retrieved 2009-04-07.
- ^ Wade, Michael S.; Wolf, Jason; Brodie, Edmund D. (2000). Epistasis and the evolutionary process. Oxford [Oxfordshire]: Oxford University Press. p. 330. ISBN 0-19-512806-0.
- ^ Mayr, Ernst, Jody Hey, Walter M. Fitch, Francisco José Ayala (2005). Systematics and the Origin of Species: on Ernst Mayr's 100th anniversary (Illustrated ed.). National Academies Press. p. 367. ISBN 9780309095365.
- ^ Howard, Daniel J.; Berlocher, Steward H. (1998). Endless Forms (Illustrated ed.). United States: Oxford University Press. p. 470. ISBN 9780195109016.
- ^ Wright S (1929). "The evolution of dominance". The American Naturalist 63 (689): 556'61. doi:10.1086/280290.
- ^ a b Stevenson, Joan C. (1991). Dictionary of Concepts in Physical Anthropology. Westport, Conn: Greenwood Press. ISBN 0-313-24756-0.
- ^ Larson, Edward J. (2004). Evolution: The Remarkable History of a Scientific Theory. Modern Library. ISBN 978-0679642886.
- ^ Kimura M (1968). "Evolutionary rate at the molecular level". Nature 217 (5129): 624'26. doi:10.1038/217624a0. PMID 5637732.
[edit] External links
|
||||||||||||||||||||||||||||||||
|
|||||||||||||||||||||||
|
SOURCES.COM is an online portal and directory for journalists, news media, researchers and anyone seeking experts, spokespersons, and reliable information resources. Use SOURCES.COM to find experts, media contacts, news releases, background information, scientists, officials, speakers, newsmakers, spokespeople, talk show guests, story ideas, research studies, databases, universities, associations and NGOs, businesses, government spokespeople. Indexing and search applications by Ulli Diemer and Chris DeFreitas.
For information about being included in SOURCES as a expert or spokesperson see the FAQ . For partnerships, content and applications, and domain name opportunities contact us.